Do you have a page on your site that isn’t engaging or converting visitors?
Are you struggling to understand why this is happening or how you can fix it?
While page (or site) performance is a complex problem with many moving parts, one key component is understanding visitor behavior.
When you understand how visitors are engaging with your page (or site), it becomes much easier to spot issues and come up with ideas for improvement.
In this article, I’m sharing some of the research methodologies I use to help my clients understand visitor behavior so we can boost engagement, conversion rate, and more.
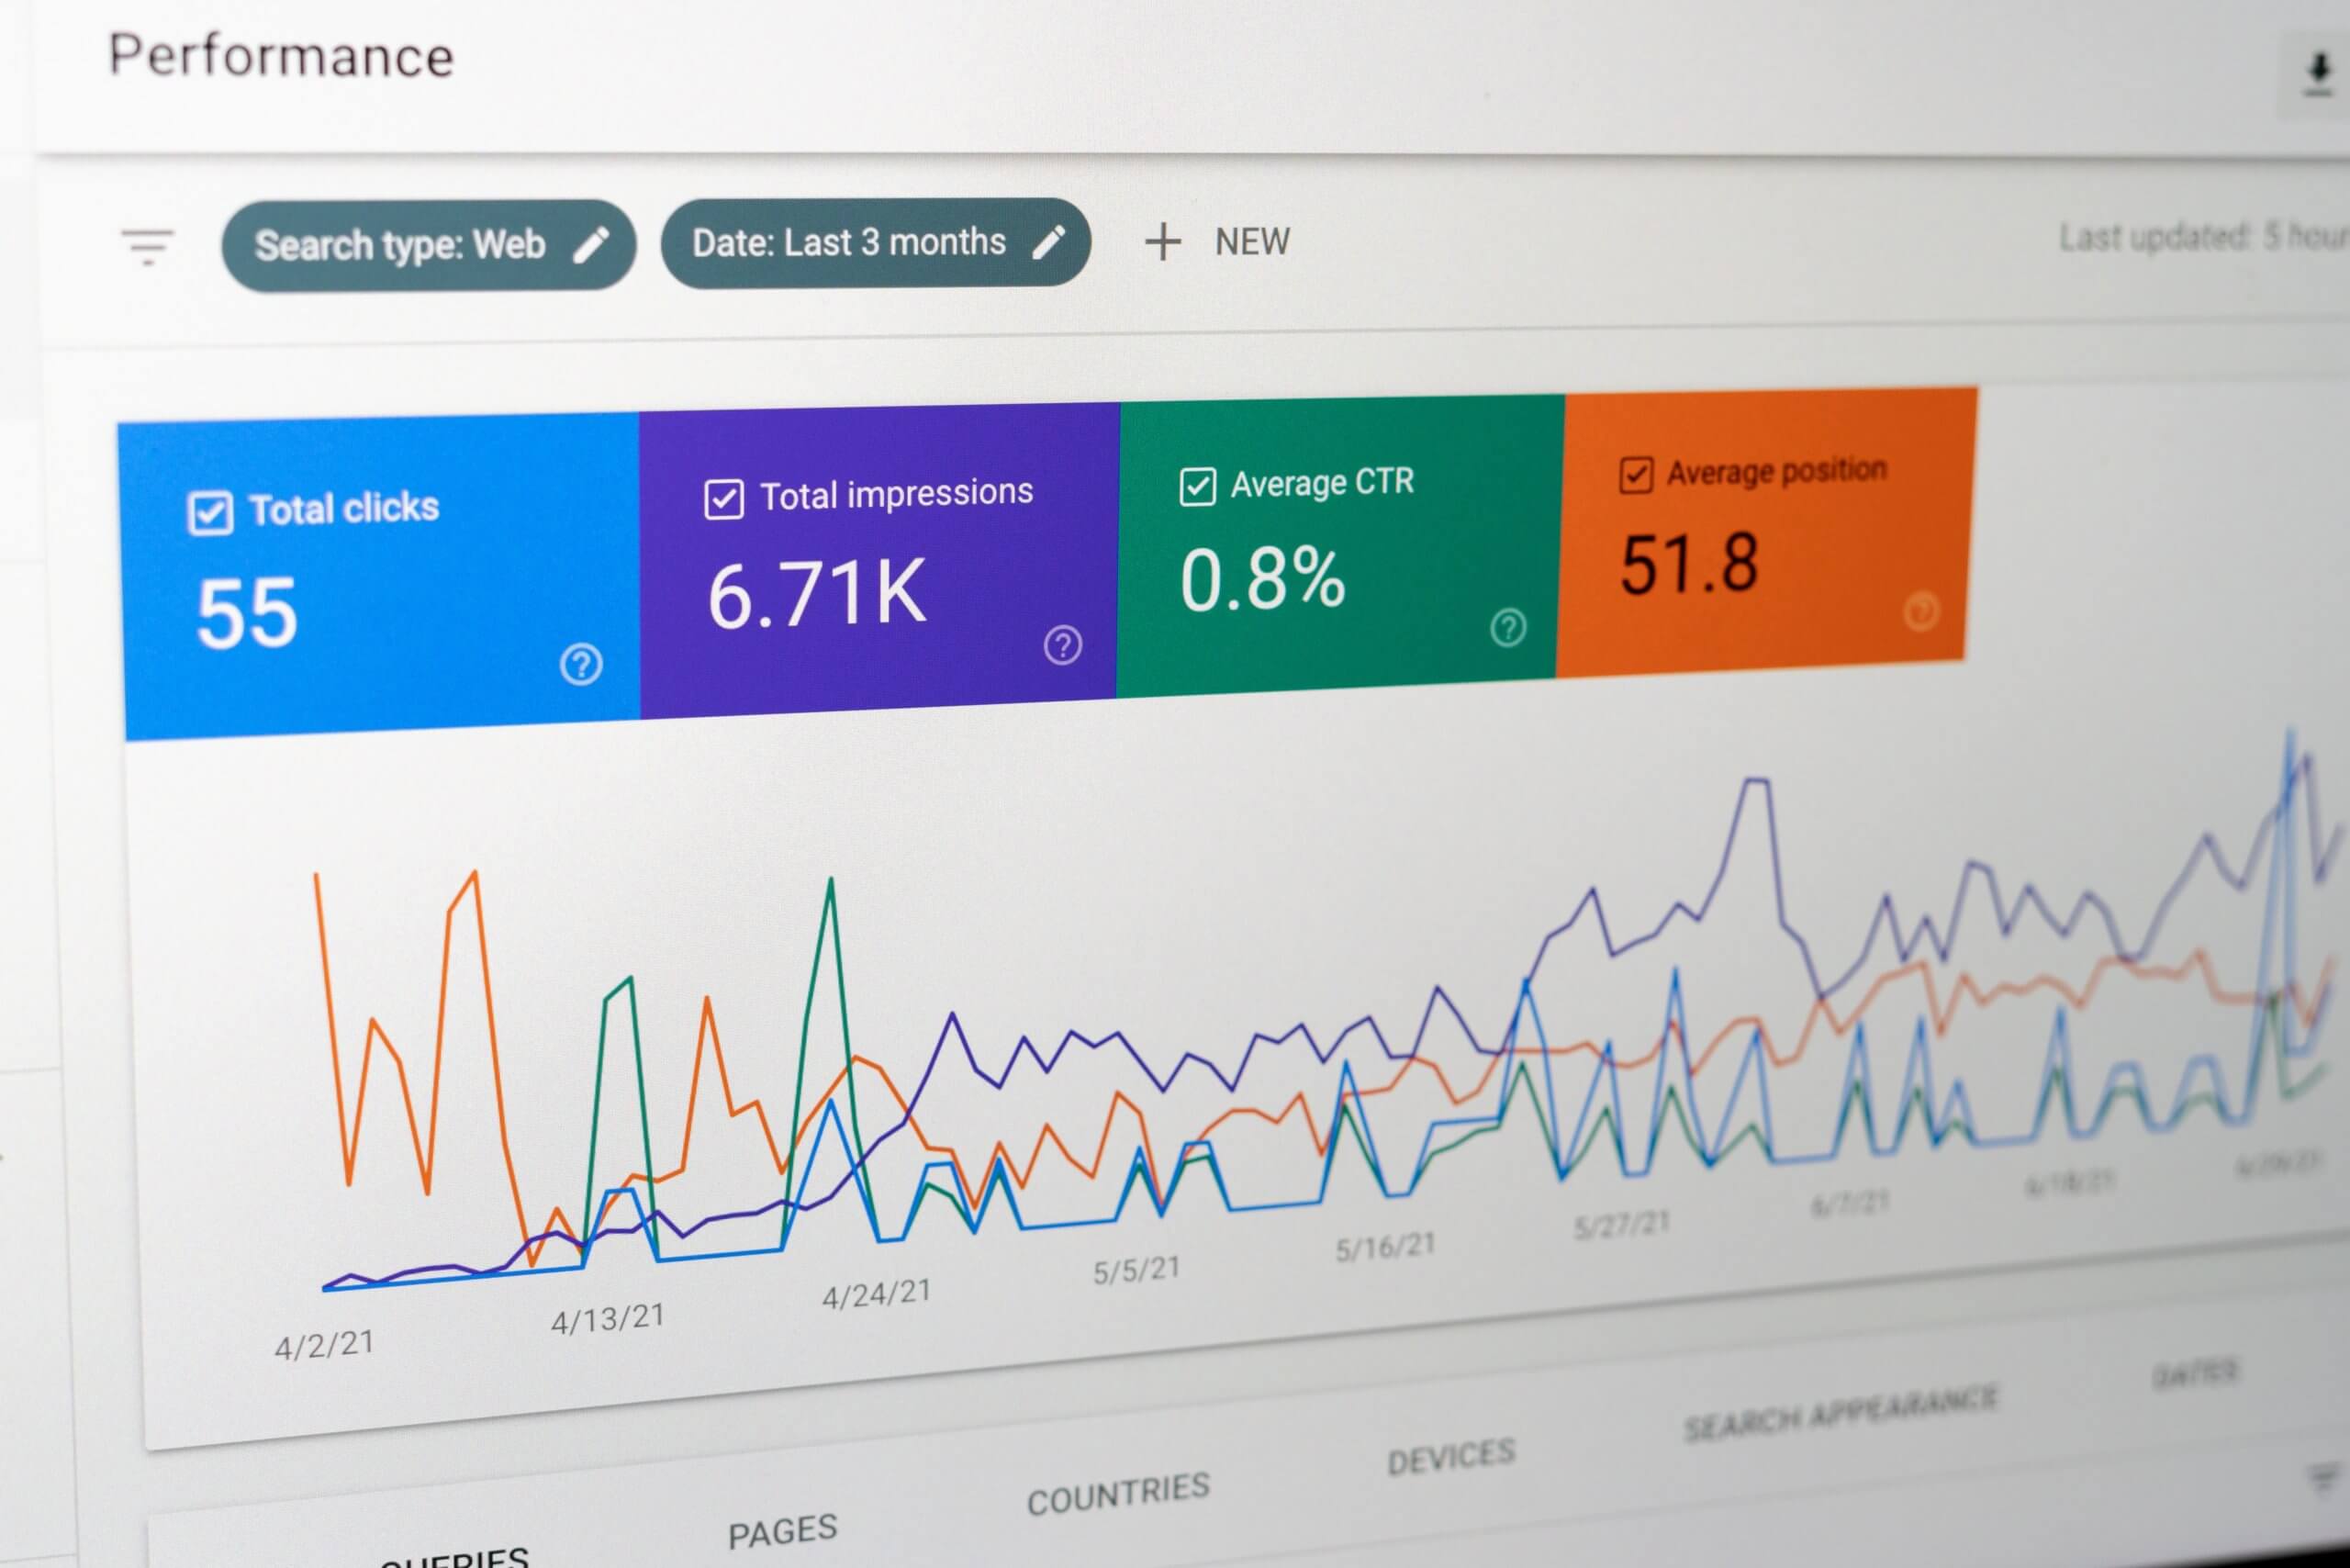
But before we dive in to the methodologies, I recommend a quick check of your Google Analytics.
Check Google Analytics
While it may seem obvious, the first step is to make sure that the page is actually getting traffic.
After all, if the page traffic is very low, that could be one reason why the page isn’t getting engagement or converting.
It’s also important to know how much traffic your page is getting, so you can decide if it makes sense to conduct additional engagement tests.
For example, let’s say you wanted to conduct a heatmap analysis — in that case, you would need at least 100 visitors to the page per month to glean any valuable insights (though ideally, you want hundreds or thousands of visits per month, as the larger the sample size, the more confidence in your data).
Google Analytics can also tell you other important stats about your page — like bounce rate, referral source, time spent on page, page speed, devices used to access it, etc — all of which can be helpful to know when trying to understand why a page isn’t performing the way you’d like.
If nothing else, it’s good to know which pages on your site visitors are gravitating toward so you can work on optimizing those pages (vs wasting time on pages that may be unimportant).
My page is getting traffic; now what?
If the page is getting traffic, but isn’t getting engagement or converting, you may want to consider implementing one (or all) of the methodologies below.
Keep in mind, research like this works best when you combine multiple, complementary methodologies in order to get a more complete (and usually more accurate) picture of the problem.
If you’re not sure which methodologies to use or how to use them, check out my course, How to Conduct, Analyze & Apply Customer Research, which includes detailed explanations (and video demo’s) of the tools listed below (and many others), as well as templates to help you organize, analyze, and apply your findings.
For the month of November, you can get $100 off the course, plus 5 LIVE training sessions for each of the core sections within the course (for deeper learning and more personalized guidance).
If the course isn’t for you, I still recommend any of the methodologies below to help you understand visitor behavior, so you can achieve the results you’re looking for.
Let’s dive in!
Conduct a Heatmap analysis
If you’re not familiar, a heatmap analysis will visually demonstrate how visitors are engaging with specific pages on your site.
All you have to do is install the software on the pages you’d like to analyze and wait for the software to capture visitor sessions.

Source: Morphio.io
Once you have a good sample size (i.e. – at least 100 captured sessions or more), you can dive into the data via clickmaps, scrollmaps, move maps, and more.
Personally, I find click maps and scroll maps to be the most valuable.
Click maps will show you exactly where visitors are clicking (or not clicking) on your page, while scroll maps will show you how far they’re scrolling down the page (so you can see where they’re engaged vs dropping off).
Being able to see the clicking and scrolling behavior of a big chunk of your visitors will help you identify behavioral patterns that provide insight into page issues or give you ideas for how to improve the page (which will undoubtedly influence page performance).
Watch visitor recordings
Visitor recordings are what they sound like: they’re videos that show you exactly how individual visitors engage with a specific page (or collection of pages, often referred to as a “user flow” or “sales funnel”).

Source: simplemachinesmarketing.com
Watching a collection of visitor recordings can help you see how visitors move through your page (or flow/funnel), how long they’re spending in specific areas, where they’re clicking, if they’re getting stuck, hitting barriers, and more.
Of course, you’ll need to watch many recordings in order to draw any solid conclusions, but if you’re focused on a specific page or flow, spotting behavioral trends or issues tends to be a little easier (vs trying to glean general insights about general visitor behavior).
Some heatmapping tools (like Hotjar, for example) also include visitor recordings within their product suite, which is nice so you don’t have to pay for separate software.
Add an on-site poll
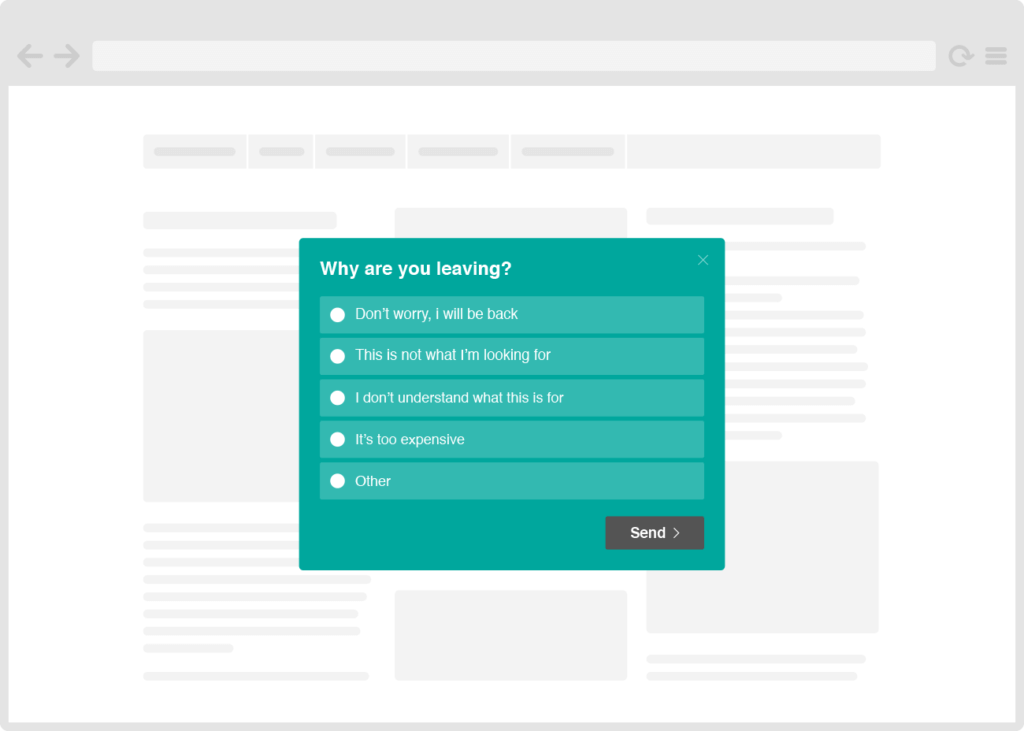
If you’d like more insight into the mindset and intent of your visitors (which is connected to page performance), try adding an interactive poll to the page you’re trying to analyze and/or improve.

Source: cxl.com
While there’s no guarantee that visitors will engage with it (though according to this article, online surveys get a response rate of 30%, on average), if you’re getting enough traffic to the page (and following survey best practices), you should be able to capture some valuable insights.
If using a poll, try asking questions like…
- “Why did you visit this page today?”
- “Why are you leaving?”
- “Did you find what you were looking for?”
- “How could this page be improved?”
Simple questions like the above may provide you with the insights you need to improve the page content, user experience, and more in order to get the engagement or conversion results you’re hoping to achieve.
Conduct usability tests
During a usability test, you provide users with a “prompt” and a series of tasks related to the page (or series of pages) in question.

Source: Teston – How unmoderated user testing works
As users complete the tasks, their on-screen behaviors are recorded via video so you can see their movements while also listening to their thought process as they go along (most usability tests require the user to speak aloud while completing the test).
If you conduct live usability tests, you can also engage directly with participants and ask follow-up questions to glean additional insights about their behavior, choices, thought processes, and more (all of which can impact page performance).
Of all of the methodologies listed in this article, usability testing is the most complex, which is why I include detailed instructions, videos, examples, and templates within my course.
Want 1-on-1 research guidance?
Do you want to improve the performance of your page, site, flow, or funnel?
Check out my course, How to Conduct, Analyze & Apply Customer Research, which will give you the skills, tools, and templates you need to confidently conduct research on your own.
For the month of November, you can get $100 off the course, plus 5 LIVE training sessions for each of the core sections within the course (for deeper learning and more personalized guidance).
There are only 20 open slots for the course, so if you’re interested, sign up today while space is still available.
If you prefer I do the research for you, awesome! Send me an email and we’ll discuss your project in detail: annie1maguire@gmail.com
I hope this information supports your page-performance goals; if you have any questions, you can always reach out directly or comment below.
Happy researching!
